Turn sales data into actionable groups
A comparative study of clustering and frequent-pattern mining methods used to build a product recommendation approach.
- Context
- Higher-education project
- Role
- Scoping, analysis, experimentation and presentation
- Status
- Completed
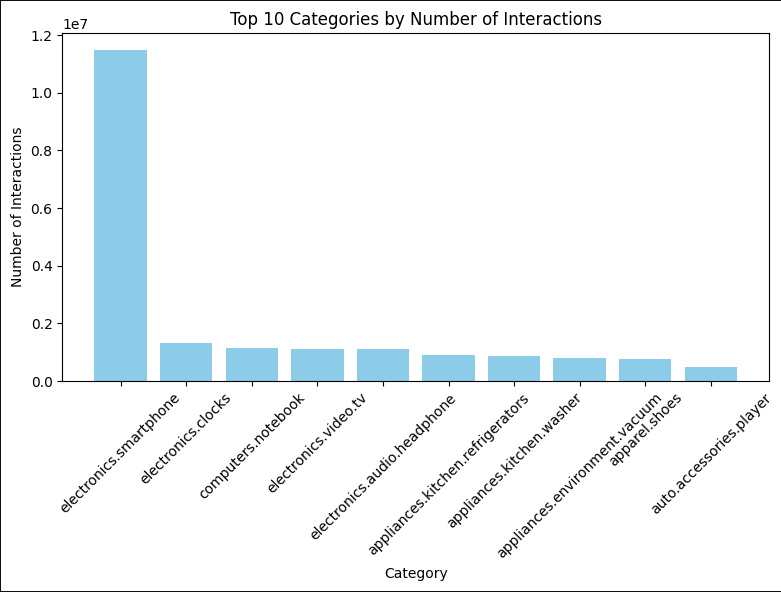
- Data → clusters → recommendations
- Several methods compared
- Documented assumptions and limitations
From raw data to an explainable decision.
Challenge
Raw sales data does not become a useful recommendation on its own. I first had to establish a reliable analytical foundation, compare grouping methods, then connect the resulting clusters to understandable product associations.
Mission
Define the approach, prepare the data, test several algorithms and present both the decisions and the results clearly.
Compare before concluding.
- 01
Scope and prepare
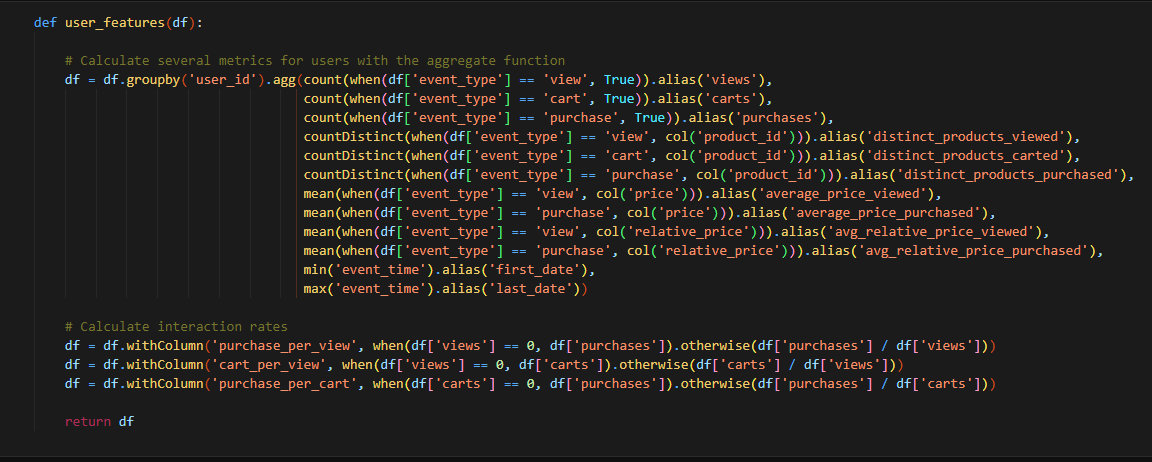
Writing the requirements and scoping documents, then cleaning, selecting and transforming the variables used in the analysis.
- 02
Compare the clusters
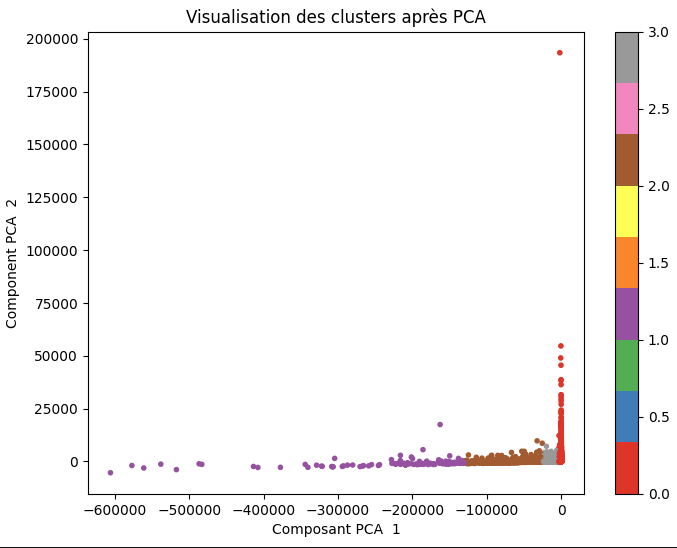
Testing K-means and DBSCAN, observing cluster structure and visualising the differences between approaches.
- 03
Connect clusters and products
Mining frequent patterns with Apriori to reveal product associations and a recommendation logic for each cluster.
- 04
Make the process verifiable
Creating charts and a final report to document the assumptions, limitations and observed results.
A useful result because it remains understandable.
This project taught me that a machine-learning result only has value when it can be explained, connected to a decision and presented with its limitations. Data preparation and the quality of the presentation matter as much as the algorithm itself.
- A structured analytical pipeline from raw data to recommendation.
- A reasoned comparison of several methods instead of a default algorithm.
- Visualisations that make clusters and findings easier to understand.
- Reusable scoping and presentation documents that explain the decisions.